Features of the Rig Vision Real-Time Web Monitoring system:
User Interface
The well real-time data can be displayed on text screens, strip chart screens, and drill screens. The user can create and save as many screens as they need. All objects are property based. This means at any time the user can easily modify their screens by clicking on an object and selecting which parameter to view, a color scheme to use, set scales on a graph and set alarm points from one popup property box. All of this is done with no interruptions to the data flow.
The screen properties can be set or changed by using the Screen Property Wizard.
Text Screens
Users will be able to select the number of rows and columns for each text screen. Clicking on a Text Box allows the user to select which parameter to view, a color scheme to use and set alarm points from one popup property box.
Strip Chart Screens
The strip chart can display depth, time, or time and depth data. Users are able to select the number of tracks for their strip chart and the number of parameters on each track. They also can select the parameters and colors. Annotation added on location will also display on the website strip charts. All strip charts scales both vertical and horizontal and alarm points are easily adjustable. The strip charts can scroll forward, backwards and can zoom in and out throughout the entire well.
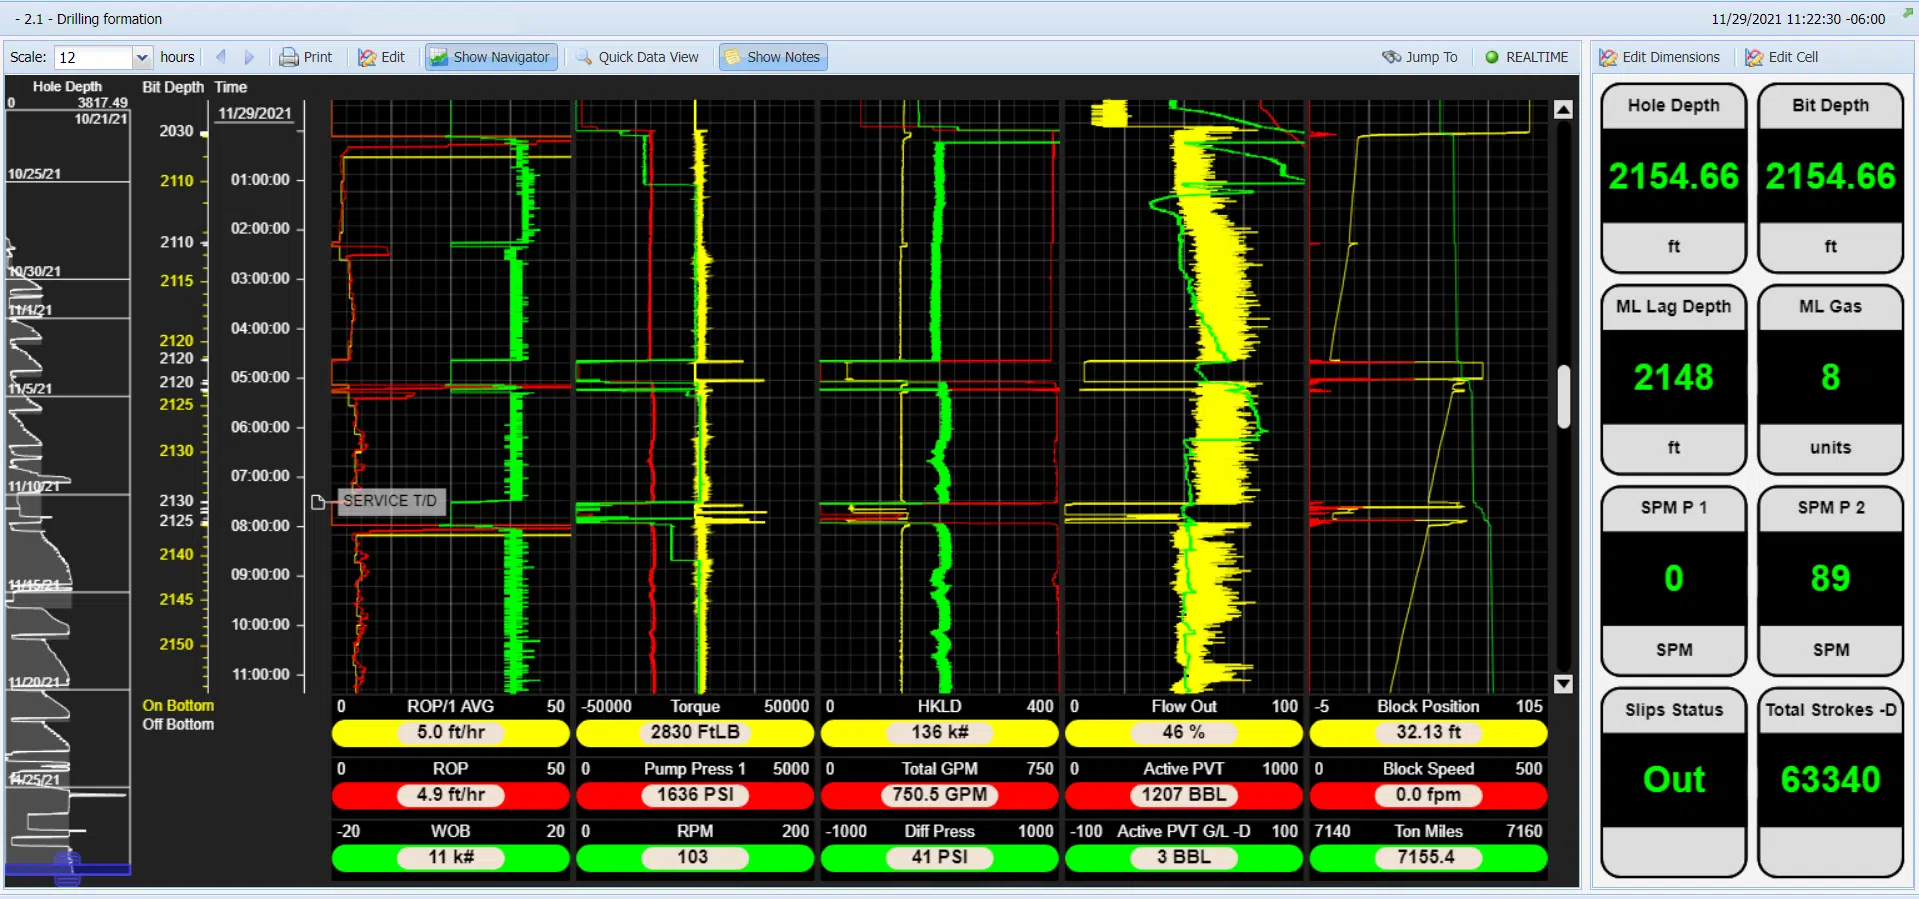
Drill Screens
Drill screens will allow the user to watch both text and graphical data on the same real time screen. They will be able to easily configure and modify these screens as needed.
War Room Screen
View multi-wells at the same time in an easy-to-view spreadsheet style format. Parameters, colors & alarms can easily be set by using its property box.
Well Comparison
The Well Comparison feature allows the user to load multiple wells to compare side by side. Each well has a scroll bar to allow the user to match trends and lock the graphs in view or produce reports.
Reports
The users can create graphical and numerical reports. The reports can be saved in templates so that they can be used to generate reports as needed. Numerical reports display columns of time or depth data. They can be saved as Adobe PDF, Microsoft Word, Microsoft Excel, or CSV files. LAS depth files can also be created. Scaled graphical reports can be easily created and displayed on the screen, saved to Adobe PDF files, or printed.
Map
This mapping tool can be used to locate a user’s wells based on the latitude and longitude of the rig. The user is able to view the location of a well on a map. They can pan and zoom in and out of the map at will. Satellite and ground view is also available with this feature.
Rig Vision Mobile
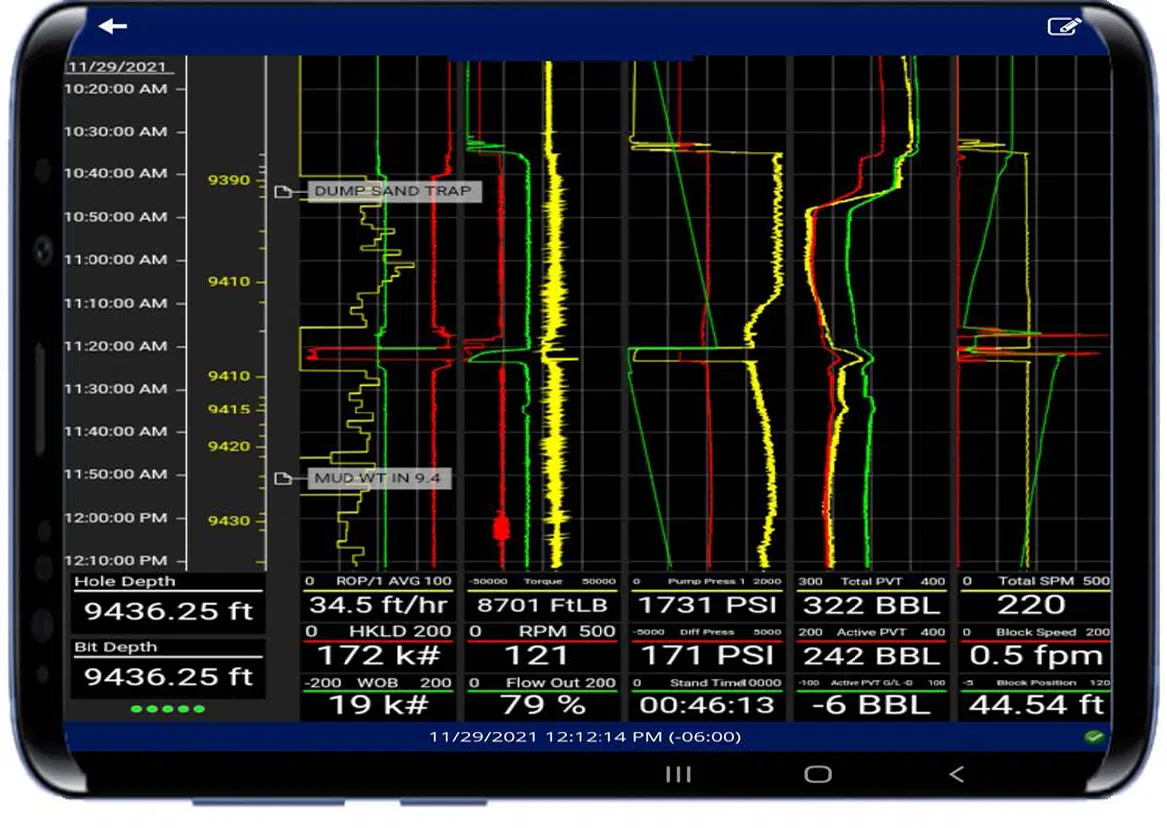

This mobile website allows users to view their rig data via their mobile devices. Strip charts, text screens and map are available 24/7 using an Android or iOS operating system.
Rig Vision Mobile is incredibly flexible, allowing users to monitor all drilling parameters including data provided by other service companies. Screens can be easily customized to meet the needs of the user from their smart phone or mobile device.
iOS Devices
Android Devices
With a simple login and password, customers can log on securely from their mobile device browser, select their well and view their data in a matter of seconds. Navigation buttons make it easy to toggle between screens.